
POINT Dashboard
ClientPOINT
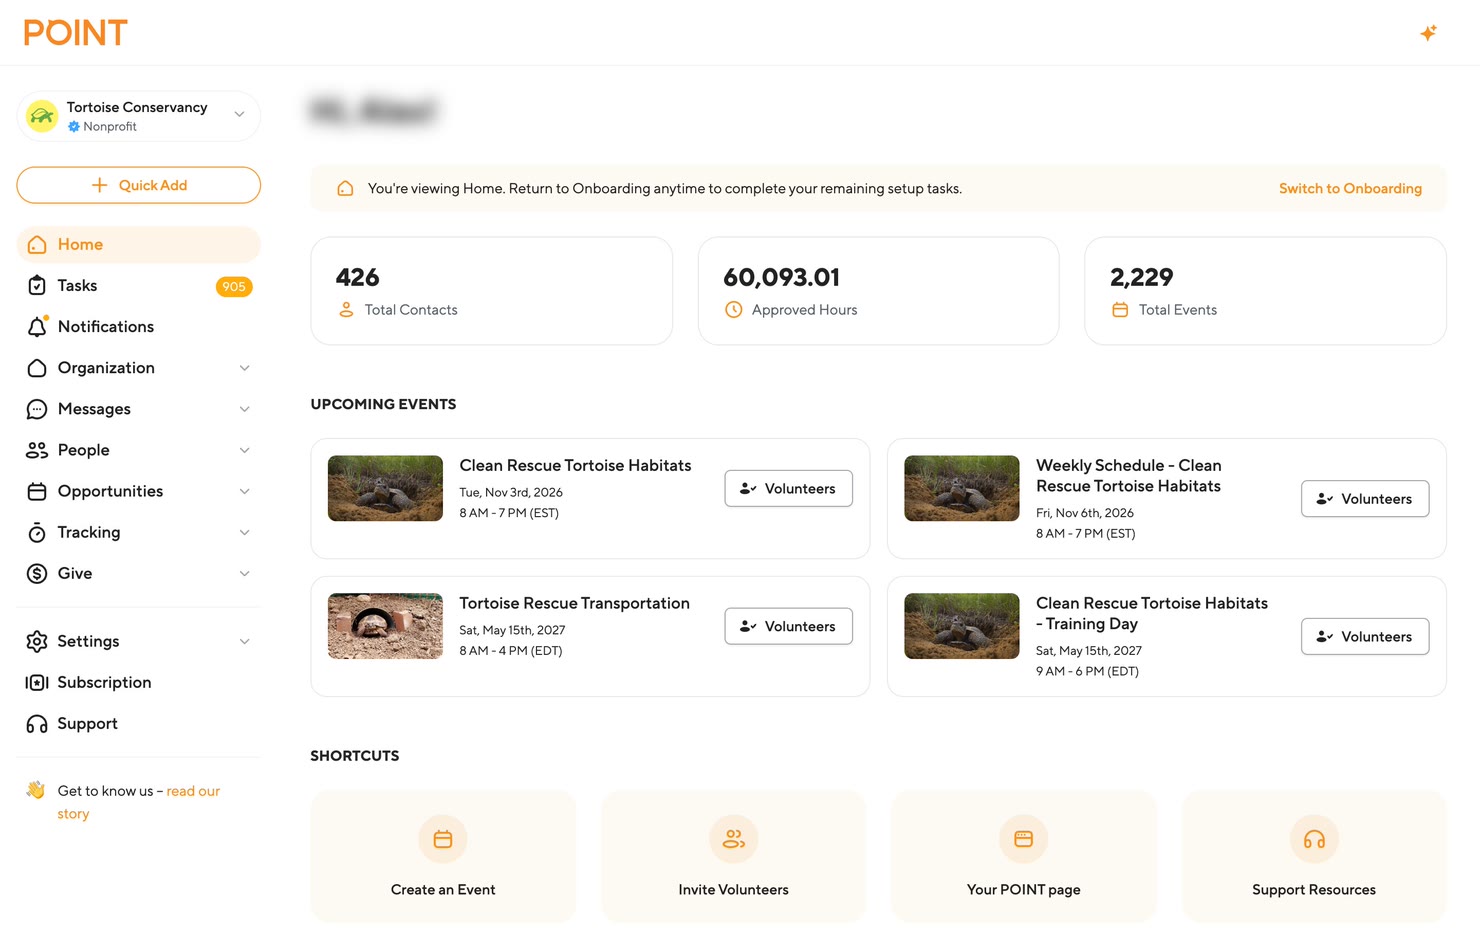
Project description:POINT’s dashboard subscriptions provide an array of demographic metrics to nonprofits, giving them the quantitative tools they need to analyze and improve their operations. This includes but is not limited to: volunteer age breakdowns, geographic analysis, hours of aggregate impact, active volunteers and monthly event engagement. When the nonprofit administrator creates an event on the POINT dashboard, the event is then filtered to volunteers who care about the cause corresponding to the event in the nearby geographic location. Volunteers can respond as ‘attending’ by selecting the event in-app, tapping ‘Go’, and when they show up to the event their attendance is automatically recorded live on the dashboard. In the event that a volunteer’s phone is dead and the automatic check-in cannot be processed, administrators can manually check volunteers in and out of events within their dashboard.
Open WebsiteVideo, 41 seconds, no sound. POINT’s admin dashboard on a laptop, with the demo organization Tortoise Conservancy. The home shows total contacts, approved hours and events, with the events coming up next. Each event shows its shifts, the spots taken and the programs it belongs to. A month calendar shows each day’s events, one click from the list. Stats show volunteers, hours, attendance and economic impact for any date range.

Tell us about your project
We’ll read what you send and reply with a free quote within 48 hours.
Get a free quote